Quantitative Volcanic Ash (QVA)
Quantitative Volcanic Ash (QVA) Concentration Information for a first familiarization
Using QVA information
Available flyer on ICAO portal contains details:
ICAO-Meteorology Panel: ICAO portal, Quantitative Volcanic Ash (QVA) Concentration Information, Flyer First edition — 13 September 2022 (corrected 21 June 2024)
Next few pages provide some useful explanation for a first familiarization using QVA.
QVA information provides users with a high-resolution four-dimensional representation of a volcanic ash cloud, providing a more realistic depiction of the ash cloud:
- a horizontal resolution of 0.25 degrees latitude and longitude.
- a vertical resolution in 5,000-foot /50 flight levels (FL) from mean sea level to FL 600
| Mean sea level to FL 50 | FL 150 to FL 200 | FL300 to FL350 | FL450 to FL500 |
| FL50 to FL 100 | FL200 to FL250 | FL350 to FL400 | FL500 to FL550 |
| FL100 to FL150 | FL250 to FL300 | FL400 to FL450 | FL550 to FL600 |
In three-hourly valid time increments: 0, 3, 6, 9, 12, 15, 18, 21 and 24 hours. QVA information will be updated as necessary but at least every six hours until the volcanic ash cloud is no longer considered a hazard. The 3-hourly time steps of QVA information provides users with more accurate forecast positions of the ash cloud, compared to the 6-hourly time steps of the VAA/VAG.
The VAAC Toulouse QVA ensemble set consists of 100 forecast predictions (+ the deterministic run). In addition to the deterministic model run, the ensemble model runs are launched with the following source term parameters modified: ash ejection height, emission profile, quantity of ash particles, size of ash particles.
Note that it is possible to have no ash exceeding a given threshold in the deterministic run and have relative frequencies exceeding that given threshold in all 100 ensemble forecast (some of the 100 forecasts predict ash cloud). This difference is representative of the uncertainty involved in describing the eruption and predicting the ash cloud.
Probabilistic QVA include the uncertainty of detection and forecast ash cloud. Currently, it isn't the case in current concentration charts; forecasters use their experiences to take in account this uncertainty providing VAA/VAG.
Deterministic and ensemble QVA data will be provided in gridded format NetCDF. In addition, IWXXM format deterministic objects representing ash concentration in the entire atmosphere from Mean Sea Level to FL600, where concentration thresholds are exceeded.
QVA information will likely have its greatest utility with ash cloud events that have a widely dispersed ash cloud with mostly lower levels of ash concentration. Operators with approval and procedures/practices, e.g., maintenance for planned flight into select thresholds of ash concentration, will be able to use QVA information to fly more efficient routes in accordance with their safety management program.
Probabilistic QVA information is intended for use in operator's flight planning and decision support systems. Operators will use probabilistic QVA information in conjunction with their safety management program to optimise airspace and plan more efficient routes during significant volcanic ash cloud events.
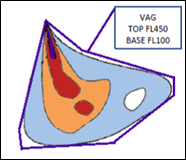
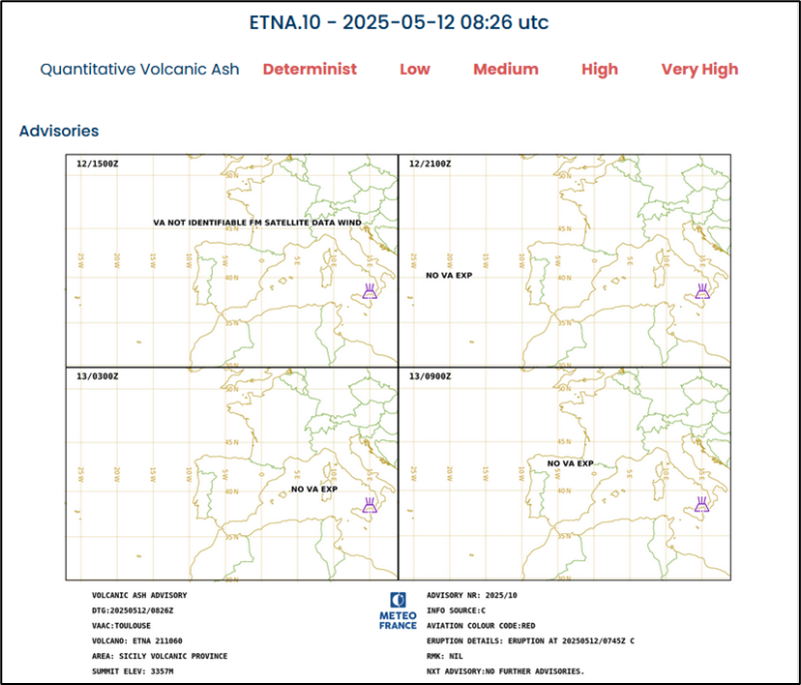
Visualized examples of QVA grid point deterministic information, IWXXM objects with volcanic ash advisory in graphic form (VAG); Comparison to actual VAG
Provided by VAAC Toulouse using MOCAGE model for the exercise VOLCAZO24 of 07 May 2024
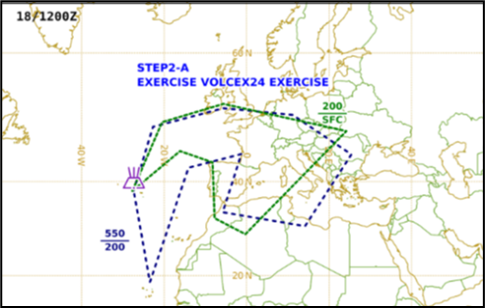
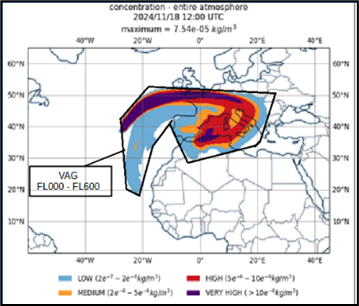
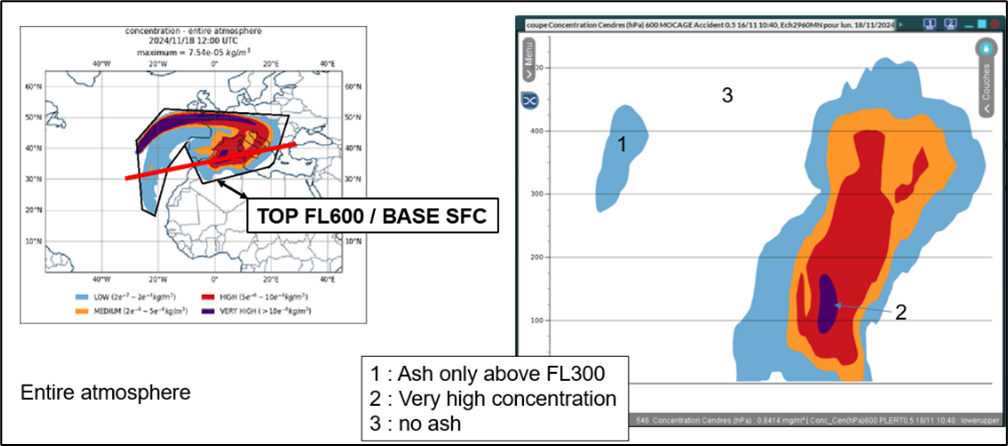
IWXXM objects represent ash concentration in entire atmosphere from Mean Sea Level to FL600, where concentration thresholds are exceeded.
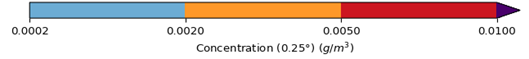
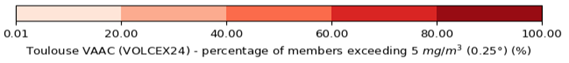
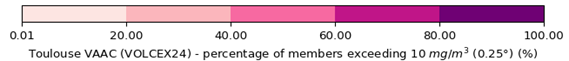
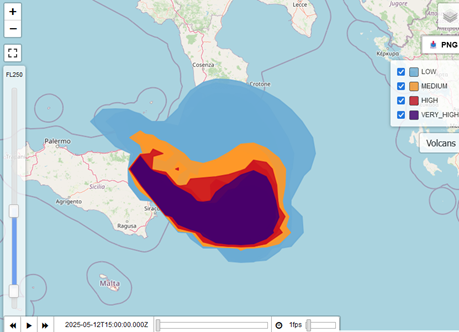
Colour Legend:
| Descriptor | Concentration thresholds and ranges | Colour |
|---|---|---|
| Very high | ≥ 10 mg/m³ | Purple |
| High | ≥ 5 and < 10 mg/m³ | Red |
| Medium | ≥ 2 and < 5 mg/m³ | Orange |
| Low | ≥ 0.2 and < 2 mg/m³ | Blue |
| Very low | < 0.2 mg/m³ | White |
Note that colours were randomly assigned and do not infer any visualization guidelines.
Individual IWXXM objects depict the individual IWXXM objects from Figure 1, respectively each threshold
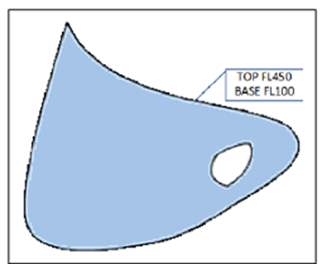
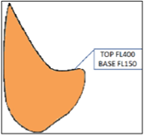
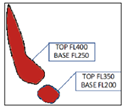
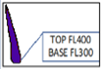
Figure 5 is IWXXM object ≥ 0.2mg/m³ (the "hole" is ash <0.2mg/m³).
Figure 6 is IWXXM object ≥ 2mg/m³.
Figure 7 is IWXXM object ≥ 5mg/m³.
Figure 8 is IWXXM object ≥ 10mg/m³.
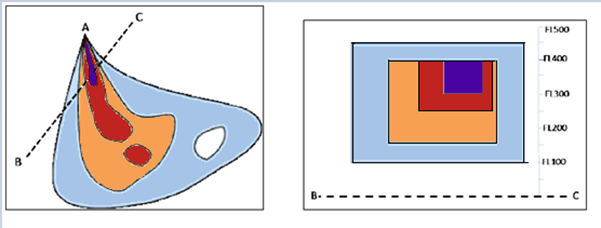
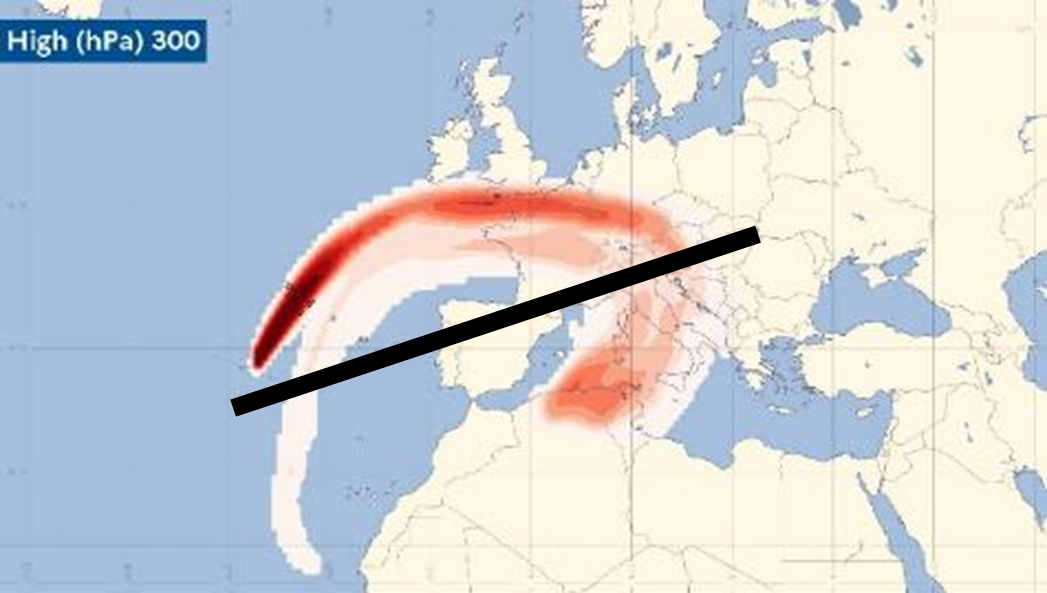
Example of deterministic QVA using MOCAGE model and vertical cross section provided during VOLCEX24
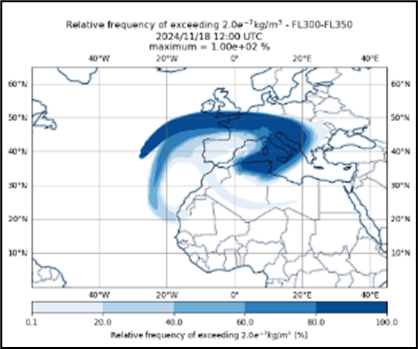
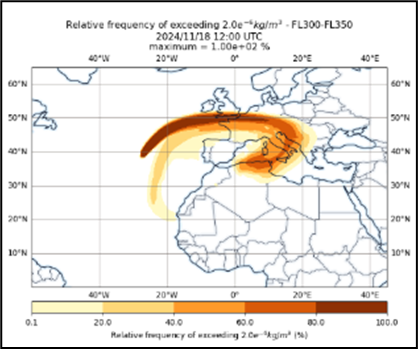
Example of gridded probabilistic data
Provided by VAAC Toulouse using MOCAGE model for the exercise VOLCEX24
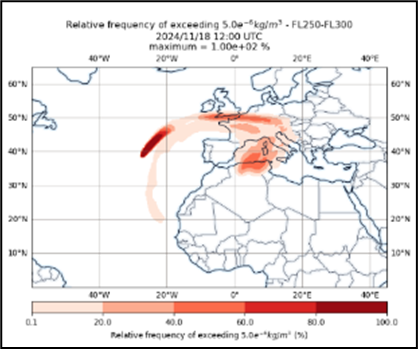
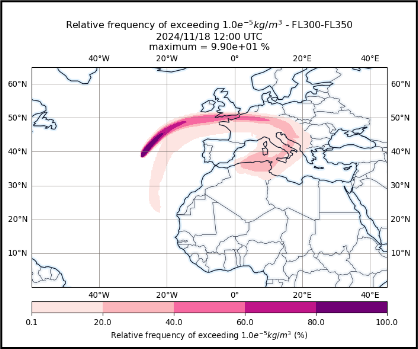
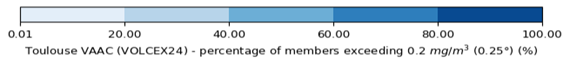
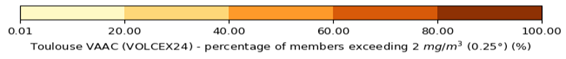
Colour Legend:
Example of probabilistic QVA using MOCAGE model and vertical cross section provided during VOLCEX24
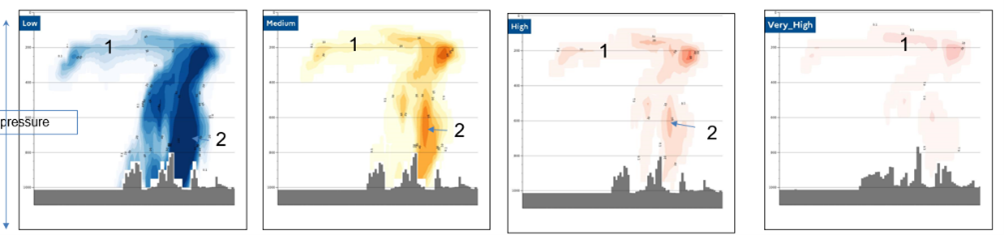
1: Probability to encounter ash in upper atmosphere
2: High probability to encounter ash but low risk in high concentration
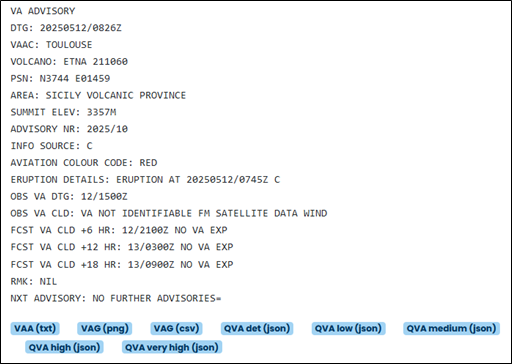
Access to QVA data on VAAC Toulouse website
Above VAG through red buttons as shown in the example below:
Under VAA through blue buttons as shown in the example below:
Deterministic QVA on website


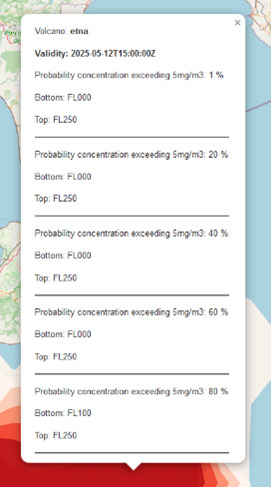
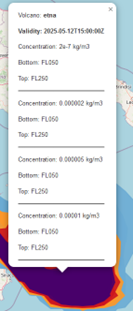
Detailed information on a location:
Access via API Metgate
Adress an email to Meteo FranceLatest OPER VAA
Latest EXER VAA
Volcanoes
Agua de pau Ashikule volcanic field Askja Calbuco Cameroon mt Campi flegrei Chaine des puys Chaiten Cordon caulle Dubbi Erta ale Etna Eyjafjoll Fayal Fogo Furnas Grimsvotn Hayli gubbi Heard Hekla Hunga tonga hunga haapai Katla La palma Merapi Meru Nabro Nyambeni hills Nyamulagira Nyamuragira Nyiragongo Ol doinyo lengai Piton de la fournaise Sete cidades Soufriere st. vincent Stromboli Tahalra volcanic field Tenerife Terceira Teyr djebel The barrier Unknown Vesuvius Vulcano